To create a successful investment portfolio, you need to analyze and understand the market trends. There are many investment and wealth management tools and apps that you can use such as the FINVIZ, Robinhood dividend app, Personal Capital, and Vanguard, among others. The FINVIZ futures bar can help you make actionable decisions on your investment allocations.
Powerful Ways to Use FINVIZ Futures to Understand Market Trends
Stock screeners, in particular, are great tools that can help you to find the best kind of stocks to invest in, for example, the FINVIZ platform. Futures and FINVIZ can be a great way to ensure that you monitoring your investments in the right way.
Don’t get caught with your pants down when the market is closed. I like to check the FINVIZ futures bar on Sunday night and before market open to ensure where the market is trending directionally.
If you need help on how to build a portfolio, check out our primer on building a dividend portfolio. We particularly like investing in dividend growth stocks since these stocks provide the best combination of income and long-term capital appreciation.
By using Robinhood, you can invest in a stock 1 share at a time. This allows for maximum flexibility in investing and reinvesting your dividend income.
If you don’t understand how Robinhood works, our guide on how Robinhood dividends work will help you.
So, what is FINVIZ?
FINVIZ which is a short form for financial visualization is a stock screening tool suite and helps you to sort stocks by market cap, volume, sector, price, analyst rating, among other criteria and helps traders who want to find new trading opportunities and backtest strategies to use.
The FINVIZ screener is a powerful financial and stock screener ideal for an active trader and is usually comprised of stock symbols, charts, maps, technical indicators, stock alerts and prices among others. The futures FINVIZ screener can specify and screen any combination of financial metric.
You can use the FINVIZ stock screener to search and sort for any investment that you want to build such as dividend growth investing, retirement account investments, forex and futures contracts or any other portfolio. It helps you to create, build and monitor profitable investment portfolio.
You can view quotes, charts and performance trends on FINVIZ instantly and be able to analyze the current market trends of futures. The FINVIZ web-based software loads data and charts very quickly.
What are stock and commodity futures?
Futures are financial binding agreements or contracts that obligate an individual to buy or to sell an underlying asset at a given price and in a specified time in future. The assets are usually physical commodities like grain, oil, metals etc or a financial instrument like the treasury bills, foreign currencies, certificates of deposit, stock index futures etc.
Futures are traded on an organized futures exchange. The buyer of the contract is said to hold a long position and the seller holds a short position. Futures are helpful to speculate hedge risks caused by the exchange rates movements, interest rates fluctuations among others risks. Futures are good determinants to know where the market is heading in the future.
To pick the best futures contracts to buy or sell is tough, FINVIZ offers a host of helpful visual tools and strategies to help you narrow down and isolate a handful of the stocks or commodities that are likely to perform well. It shows a snapshot of the sectors future charts in one page and individual stock and commodity performance.
Sometimes a little visual simplicity can go a long way…
Guide to help you navigate FINVIZ futures tool and screener
FINVIZ futures tool can help you improve your investment returns. For example, if the futures market is calling for an increase in the price of oil, you can make several decisions about how this will effect oil and gas, refining or even renewable energy stocks.
The FINVIZ futures tool is a great way to get a macroeconomic perspective on the market. Don’t let the thought that the futures market is for traders only.
Open the FINVIZ website
To start off, open FINVIZ. Across the top navigation bar, there are dozens of buttons that include maps which relate to visual heat maps that show which futures, stocks or forex are moving up or dropping. The data may be overwhelming especially for a beginner but don’t be, here is the next step.
Click on the FINVIZ screener bar
Click the FINVIZ screener and this will open a new page with more drop-down menu bars that you can customize to get a security with your chosen metrics. Here you can find a bar to help you select order, signal, and tickers. The order helps you to specify if you want results for narrow down based on a company, a sector, dividend yield, price-earnings, payout ratio, and market cap among others usually displayed in a descending or ascending order.
The signal bar gives you the option to choose a specific metric like the top gainers, top losers, a new high, new lows, upgrades, and downgrades among others. You can then select your own filters.
See Related: Alternatives to Yahoo! Finance
Next Step for using FINVIZ futures and stock screener
Click on the descriptive bar and choose the metrics as indicated on the drop-down menus. You can select as many filters or as few as you want. I love how many options they have. This is a great way to hone in on the exact details of a stock.
For example, you can then select:
- An index e.g. S&P 500 or DJIA,
- An exchange, for example, NYSE or NASDAQ
- A sector such as consumer goods or financials.
- If you choose consumer goods, you can then select an industry like the dairy products or beverages and if you choose financials, you can then select an investment like ETFs, stocks, closed-end debts etc.
- The country you want to screen on such as USA, Canada etc.
Then, select the fundamental bar and choose the filter that you want. This is characterized mostly by the financial ratios and you can select a percentage on the drop-down menu.
Then, select the technical bar and choose the filters which are mostly the moving average metrics, performance beta, and candlestick among others. The number of filters that you have selected will reflect on each of the bars and the total on the all bar.
Try to find more insights on the steps of using the FINVIZ screener and practice on the platform until you get fully conversant with it.
To get the result, it will indicate the total number of results found just below the menu bars and filters. To see further results, just choose the bars at the bottom line which shows the overview, valuation, financial, performance, technical, custom, charts, tickers, Basic, TA, news, snapshots, and stats.
All these information will help you to understand the market trends of the futures based on your selected filters. You can save and edit your presets if you click on the button shown as “my presets” and perform as many analyses as possible to understand the future trends.
You can view how we use the FINVIZ stock screener to find undervalued dividend growth stocks.
I suggest trying to find dividend growth stocks with the following qualitative and quantitative characteristics:
- Operational excellence
- Maintain a strong management team
- Construct an optimal balance sheet through disciplined financial controls
FINVIZ has an ads feature that you can choose to just ignore for the time being. Additionally, the FINVIZ platform has a Stocktwits feed feature on the lower right rail where you can view the latest community comments about the stocks. Give us a follow on Stocktwits if you aren’t already millionairemob!
FINVIZ Futures Bar
Futures FINVIZ data is also offered under the futures bar that you can click to get visually intuitive heat maps that allow you to quickly spot the areas of the market and how they are performing over different periods. All commodities such as metals, cocoa, cotton, crude oil, natural gas, coffee, soybeans are presented for easy viewing. The intuitive heat maps can be used to spot the stocks that are in red, green and black each day.
FINVIZ futures charts show information from insider trading to earnings release that a trader can use to analyze the market trends. The charts can easily be customized to your own setting preferences and you are also able to save your portfolio of stocks to watchlists for easier tracking and review. The futures and commodities charts include the futures indices, bonds, energy, metals and grains charts.
All this information from the FINVIZ futures platform can help you to analyze and understand the futures market trends.
The FINVIZ futures bar shows quotes, performance and charts based on the minute, hour, week or month. These are all filterable based on:
- Indices
- Energy
- Bonds
- Soft Commodites
- Metals
- Meats
- Grains
- Currencies
Let’s break down how each of these series works.
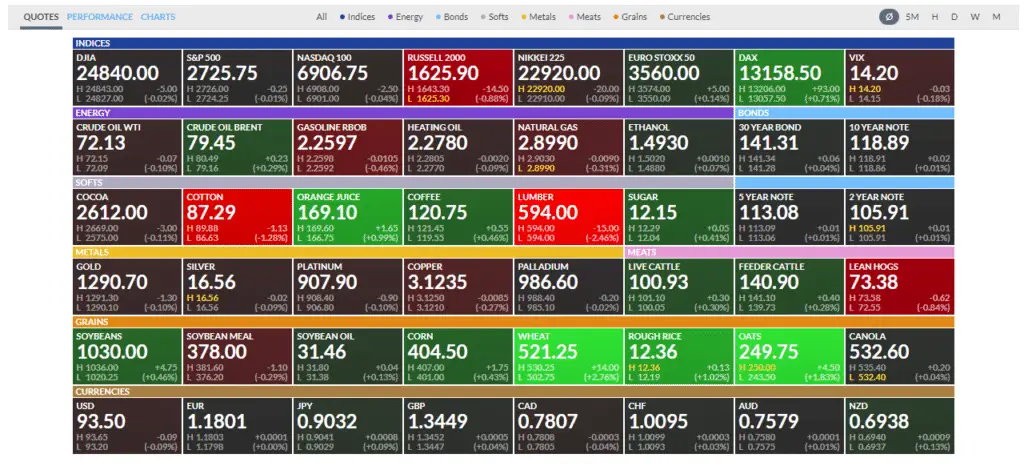
Futures Quotes
Here is a view of the awesome breakdown of the futures market by indices, energy, soft commodoties
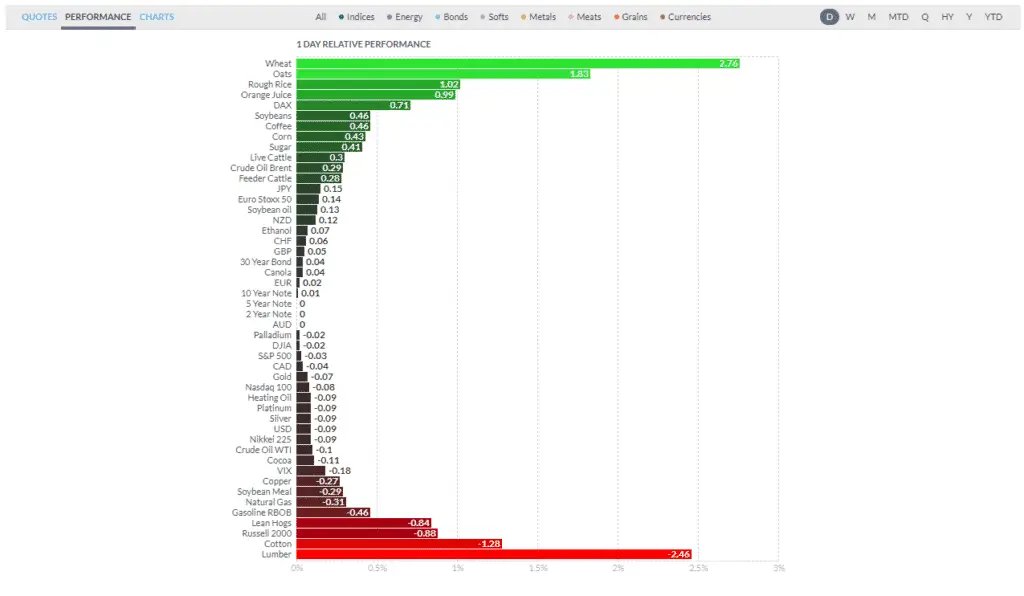
Futures Performance
FINVIZ is called financial visualization for a reason… look how they creatively breakdown the performance of all futures markets.
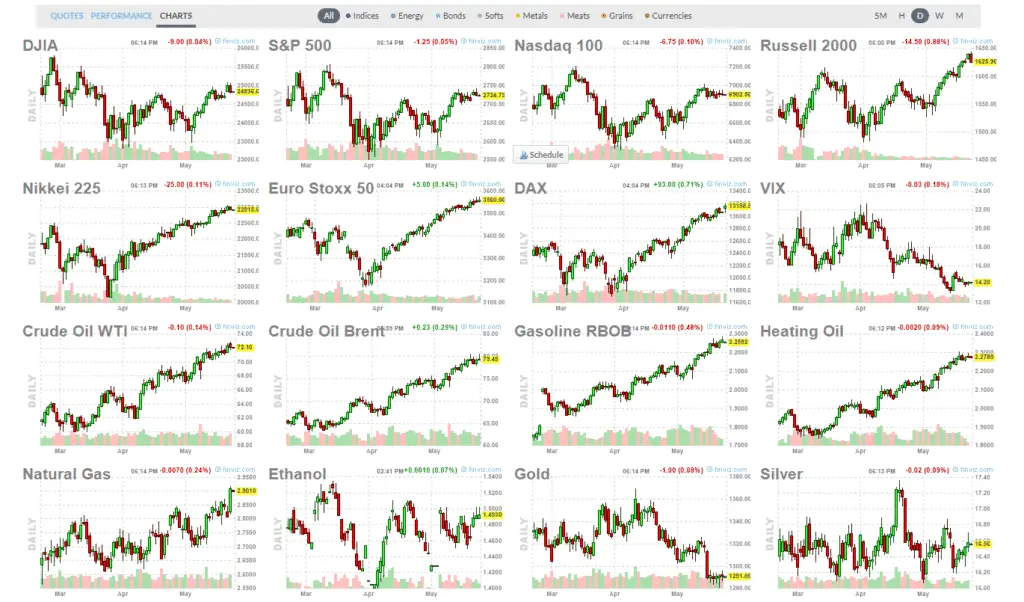
Futures Charts
With FINVIZ futures charts, you can visually see the entire futures markets trends. I love looking at this to generate new investment ideas. There is so much that you can decipher from taking 10 minutes to review.
FINVIZ Futures Pricing
It has a free user access where the users can get access to quotes, charts, and other data for free (as shown above). It allows the user to get a demo account.
However, to access real-time and pre-market data, intra-day charts, back-testing, fundamental and advanced charts, alerts, notifications, correlations and remove ad interruptions, you will need to sign up for the FINVIZ Elite where you pay a monthly fee of $39.50 or the annual price of $299.50.
With FINVIZ Elite, you can be able to make quicker decisions and find out actionable trades and investments and that helps to boost your investment returns.
Where will FINVIZ futures take you?
FINVIZ futures is one of the best stock screening platforms today that can help you understand market trends to make an ideal investment decision. I hope this guide has given you some helpful insights. By using FINVIZ, will you try to build a dividend portfolio? Or, use FINVIZ futures to help you reduce risk during stock market volatility.
We’ve given you the necessary steps to ensure you build a highly successful dividend portfolio. Try investing in your first Dividend King.
After I make an investment, I usually make sure my investment account is synced up with my WeVest and Personal Capital accounts so I can track investment performance, dividend income and ensure I’m on track for early retirement.
Or, need some help with other wealth management resources? We can help you achieve financial freedom and boost your investment returns.
Do you use FINVIZ futures to make a decision? Let us know in the comments below. We’d love to hear from you.
With both a million rewards points and a million dollar net worth you can live a happier lifestyle. Subscribe to the Millionaire Mob early retirement blog newsletter to find out the best travel tips, dividend growth stocks, passive income ideas and more. Achieve the financially free lifestyle you’ve always wanted.
Join our community of over 3,000 mobsters seeking financial freedom. What are you waiting for?
Escalate Your Life.
Using FINVIZ futures to Understand Stock Market Trends





No Comment